Analyze Data with AI
You can use Daytona Sandbox to run AI-generated code to analyze data. Here’s how the AI data analysis workflow typically looks:
- Your user has a dataset in CSV format or other formats.
- You prompt the LLM to generate code (usually Python) based on the user’s data.
- The sandbox runs the AI-generated code and returns the results.
- The LLM receives feedback from the execution and can iterate multiple times to refine the code if needed.
- You display the final results to the user.
Build an AI Data Analyst with Daytona
This example shows how to build an AI-powered data analyst that automatically generates insights and visualizations from CSV data using Daytona’s secure sandbox environment.
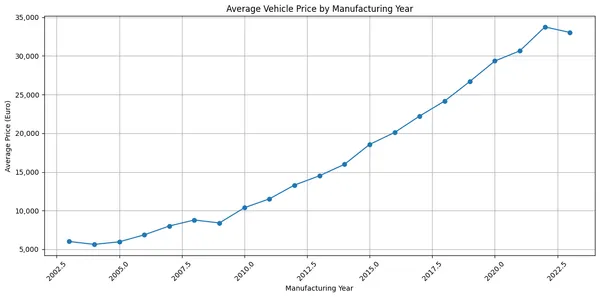
What we’ll build: A system that analyzes a vehicle valuation dataset, identifies price relation to manufacturing year, and generates professional visualizations - all through natural language prompts to Claude. The system uses an agentic loop that allows Claude to iteratively refine the code based on execution results.
1. Project Setup
1.1 Install Dependencies
Install the Daytona SDK and Anthropic SDK to your project:
bash pip install daytona anthropic python-dotenv
bash npm install @daytonaio/sdk @anthropic-ai/sdk dotenv
bash gem install daytona anthropic dotenv
1.2 Configure Environment
Get your API keys and configure your environment:
- Daytona API key: Get it from Daytona Dashboard
- Anthropic API key: Get it from Anthropic Console
Create a .env file in your project:
DAYTONA_API_KEY=dtn_***ANTHROPIC_API_KEY=sk-ant-***2. Dataset Preparation
2.1 Download Dataset
We’ll be using a publicly available dataset of vehicle valuation. You can download it directly from:
https://download.daytona.io/dataset.csv
Download the file and save it as dataset.csv in your project directory.
2.2 Initialize Sandbox
Now create a Daytona sandbox and upload your dataset:
from dotenv import load_dotenvfrom daytona import Daytonaimport os
load_dotenv()
# Create sandbox
daytona = Daytona() # The sandbox language is Python by default.sandbox = daytona.create()
# Upload the dataset to the sandbox
sandbox.fs.upload_file("dataset.csv", "/home/daytona/dataset.csv")
import 'dotenv/config'import { Daytona } from '@daytonaio/sdk';
// Create sandboxconst daytona = new Daytona(); // The sandbox language is Python by default.const sandbox = await daytona.create()
// Upload the dataset to the sandboxawait sandbox.fs.uploadFile('dataset.csv', '/home/daytona/dataset.csv')require 'daytona'require 'dotenv/load'
# Create sandboxdaytona = Daytona::Daytona.new # The sandbox language is Python by default.sandbox = daytona.create
# Upload the dataset to the sandboxsandbox.fs.upload_file(File.read('dataset.csv'), '/home/daytona/dataset.csv')3. Building the AI Data Analyst
Now we’ll create the core functionality that connects Claude with Daytona to analyze data and generate visualizations.
3.1 Code Execution Handler
First, let’s create a function to handle code execution and chart extraction. This function returns execution results that can be fed back to the AI model:
import base64from typing import TypedDict
class ExecutionResult(TypedDict):    stdout: str    exit_code: int    charts: list
def run_ai_generated_code(sandbox, ai_generated_code: str) -> ExecutionResult:    execution = sandbox.process.code_run(ai_generated_code)
    result = ExecutionResult(        stdout=execution.result or "",        exit_code=execution.exit_code,        charts=execution.artifacts.charts if execution.artifacts else []    )
    # Save any charts that were generated    if execution.artifacts and execution.artifacts.charts:        result_idx = 0        for chart in execution.artifacts.charts:            if chart.png:                filename = f'chart-{result_idx}.png'                with open(filename, 'wb') as f:                    f.write(base64.b64decode(chart.png))                print(f'✓ Chart saved to {filename}')                result_idx += 1
    return result
import fs from 'fs'import { Sandbox } from '@daytonaio/sdk'
interface ExecutionResult { stdout: string exitCode: number charts?: Array<{ png?: string }>}
async function runAIGeneratedCode( sandbox: Sandbox, aiGeneratedCode: string): Promise<ExecutionResult> { const execution = await sandbox.process.codeRun(aiGeneratedCode)
const result: ExecutionResult = { stdout: execution.result || "", exitCode: execution.exitCode, charts: execution.artifacts?.charts }
// Save any charts that were generated if (execution.artifacts?.charts) { let resultIdx = 0 for (const chart of execution.artifacts.charts) { if (chart.png) { const filename = `chart-${resultIdx}.png` fs.writeFileSync(filename, chart.png, { encoding: 'base64' }) console.log(`✓ Chart saved to ${filename}`) resultIdx++ } } }
return result}3.2 Creating the Analysis Prompt
Next, we’ll create the prompt that tells Claude about our dataset and what analysis we want. This prompt includes:
- Dataset schema and column descriptions
- The specific analysis request (vehicle price variation by manufacturing year)
- Instructions for code generation
from anthropic import Anthropic
prompt = f"""I have a CSV file with vehicle valuations saved in the sandbox at /home/daytona/dataset.csv.
Relevant columns:- 'year': integer, the manufacturing year of the vehicle- 'price_in_euro': float, the listed price of the vehicle in Euros
Analyze how price varies by manufacturing year.Drop rows where 'year' or 'price_in_euro' is missing, non-numeric, or an outlier.Create a line chart showing average price per year.Write Python code that analyzes the dataset based on my request and produces a matplotlib chart accordingly.Always finish with plt.show() to display the chart."""
anthropic = Anthropic()
import Anthropic from '@anthropic-ai/sdk'
const prompt = `I have a CSV file with vehicle valuations saved in the sandbox at /home/daytona/dataset.csv.
Relevant columns:- 'year': integer, the manufacturing year of the vehicle- 'price_in_euro': float, the listed price of the vehicle in Euros
Analyze how price varies by manufacturing year.Drop rows where 'year' or 'price_in_euro' is missing, non-numeric, or an outlier.Create a line chart showing average price per year.Write Python code that analyzes the dataset based on my request and produces a matplotlib chart accordingly.Always finish with plt.show() to display the chart.`
const anthropic = new Anthropic({ apiKey: process.env.ANTHROPIC_API_KEY })3.3 Tool Definition
Define the tool that allows Claude to execute Python code in the sandbox:
tools = [ { 'name': 'run_python_code', 'description': 'Run Python code in the sandbox environment and get execution results', 'input_schema': { 'type': 'object', 'properties': { 'code': { 'type': 'string', 'description': 'The Python code to run', }, }, 'required': ['code'], }, },]import type { Tool, ToolUseBlock } from '@anthropic-ai/sdk/resources/messages.mjs'
const tools: Tool[] = [ { name: 'run_python_code', description: 'Run Python code in the sandbox environment and get execution results', input_schema: { type: 'object', properties: { code: { type: 'string', description: 'The Python code to run', }, }, required: ['code'], }, },]3.4 Agentic Loop Implementation
Now we’ll implement the agentic loop that allows Claude to iteratively refine the code based on execution feedback. This enables Claude to fix errors, handle edge cases, and improve the analysis through multiple iterations:
# Initialize conversation historymessages = [{'role': 'user', 'content': prompt}]
continue_loop = Trueiteration_count = 0max_iterations = 10
print("Starting agentic loop...\n")
while continue_loop and iteration_count < max_iterations:    iteration_count += 1    print(f"\n=== Iteration {iteration_count} ===")    print("Waiting for the model response...")
    # Get response from Claude    msg = anthropic.messages.create(        model='claude-sonnet-4-5',        max_tokens=64000,        messages=messages,        tools=tools    )
    # Log Claude's text response    for content_block in msg.content:        if content_block.type == 'text':            print("\nClaude's response:")            print(content_block.text)
    # Check if Claude wants to use any tools    tool_uses = [block for block in msg.content if block.type == 'tool_use']
    if len(tool_uses) == 0:        # No more tool uses, Claude is done        print("\nTask completed - no more actions needed.")        continue_loop = False        break
    # Add Claude's response to message history    messages.append({'role': 'assistant', 'content': msg.content})
    # Execute all tool calls and collect results    tool_results = []
    for tool_use in tool_uses:        if tool_use.name == 'run_python_code':            code = tool_use.input['code']            print("\n--- Executing Python code in sandbox ---")            print(code)            print("--- End of code ---\n")
            # Execute the code in the sandbox            execution_result = run_ai_generated_code(sandbox, code)
            # Format the tool result            result_content = ""            if execution_result['exit_code'] == 0:                result_content += "Execution successful!\n\n"                if execution_result['stdout']:                    result_content += f"Output:\n{execution_result['stdout']}\n"                if execution_result['charts'] and len(execution_result['charts']) > 0:                    result_content += f"\nGenerated {len(execution_result['charts'])} chart(s)."                else:                    result_content += "\nNote: No charts were generated. Make sure to use plt.show() to display the chart."            else:                result_content += f"Execution failed with exit code {execution_result['exit_code']}\n\n"                if execution_result['stdout']:                    result_content += f"Output:\n{execution_result['stdout']}\n"
            tool_results.append({                'type': 'tool_result',                'tool_use_id': tool_use.id,                'content': result_content            })
            print("Execution result sent back to Claude.")
    # Add tool results to conversation history    messages.append({'role': 'user', 'content': tool_results})
if iteration_count >= max_iterations:    print("\n⚠️  Reached maximum iteration limit. Task may not be complete.")
print("\n=== Agentic loop completed ===")
import type { MessageParam } from '@anthropic-ai/sdk/resources/messages.mjs'
interface CodeRunToolInput { code: string}
// Initialize conversation historyconst messages: MessageParam[] = [ { role: 'user', content: initialPrompt }]
let continueLoop = truelet iterationCount = 0const maxIterations = 10
console.log("Starting agentic loop...\n")
while (continueLoop && iterationCount < maxIterations) { iterationCount++ console.log(`\n=== Iteration ${iterationCount} ===`) console.log("Waiting for the model response...")
// Get response from Claude const stream = anthropic.messages.stream({ model: 'claude-sonnet-4-5', max_tokens: 64000, messages: messages, tools: tools })
const message = await stream.finalMessage()
// Log Claude's text response for (const contentBlock of message.content) { if (contentBlock.type === 'text') { console.log("\nClaude's response:") console.log(contentBlock.text) } }
// Check if Claude wants to use any tools const toolUses = message.content.filter( (block): block is ToolUseBlock => block.type === 'tool_use' )
if (toolUses.length === 0) { // No more tool uses, Claude is done console.log("\nTask completed - no more actions needed.") continueLoop = false break }
// Add Claude's response to message history messages.push({ role: 'assistant', content: message.content })
// Execute all tool calls and collect results const toolResults = []
for (const toolUse of toolUses) { if (toolUse.name === 'run_python_code') { const code = (toolUse.input as CodeRunToolInput).code console.log("\n--- Executing Python code in sandbox ---") console.log(code) console.log("--- End of code ---\n")
// Execute the code in the sandbox const executionResult = await runAIGeneratedCode(sandbox, code)
// Format the tool result let resultContent = "" if (executionResult.exitCode === 0) { resultContent += "Execution successful!\n\n" if (executionResult.stdout) { resultContent += `Output:\n${executionResult.stdout}\n` } if (executionResult.charts && executionResult.charts.length > 0) { resultContent += `\nGenerated ${executionResult.charts.length} chart(s).` } else { resultContent += "\nNote: No charts were generated. Make sure to use plt.show() to display the chart." } } else { resultContent += `Execution failed with exit code ${executionResult.exitCode}\n\n` if (executionResult.stdout) { resultContent += `Output:\n${executionResult.stdout}\n` } }
toolResults.push({ type: 'tool_result' as const, tool_use_id: toolUse.id, content: resultContent })
console.log("Execution result sent back to Claude.") } }
// Add tool results to conversation history messages.push({ role: 'user', content: toolResults })}
if (iterationCount >= maxIterations) { console.log("\n⚠️ Reached maximum iteration limit. Task may not be complete.")}
console.log("\n=== Agentic loop completed ===")The agentic loop works as follows:
- Initial Request: Send the initial prompt to Claude with the tool definition
- Iteration Loop: For each iteration (up to 10 times):
- Claude generates a response with optional tool calls
- If there are tool calls, execute the Python code in the sandbox
- Send execution results back to Claude (including errors or success messages)
- Claude can then refine the code based on the feedback
- Completion: Loop ends when Claude signals no more tool calls are needed or max iterations reached
This approach allows Claude to:
- Fix errors if the initial code fails
- Iterate on the analysis if results aren’t satisfactory
- Handle edge cases discovered during execution
- Improve visualizations based on the actual data
Key advantages of this approach:
- Secure execution: Code runs in isolated Daytona sandboxes
- Automatic artifact capture: Charts, tables, and outputs are automatically extracted
- Error handling: Built-in error detection and logging
- Language agnostic: While we used Python here, Daytona supports multiple languages
4. Running Your Analysis
Now you can run the complete code to see the results.
python data-analysis.pynpx tsx data-analysis.tsYou should see the chart in your project directory that will look similar to this:
5. Complete Implementation
Here are the complete, ready-to-run examples with the agentic loop:
import base64from dotenv import load_dotenvfrom daytona import Daytona, Sandboxfrom anthropic import Anthropicfrom typing import TypedDict

class ExecutionResult(TypedDict):    stdout: str    exit_code: int    charts: list

def main():    load_dotenv()
    # Create sandbox    daytona = Daytona()    sandbox = daytona.create()
    # Upload the dataset to the sandbox    sandbox.fs.upload_file("dataset.csv", "/home/daytona/dataset.csv")
    initial_prompt = """I have a CSV file with vehicle valuations saved in the sandbox at /home/daytona/dataset.csv.
Relevant columns:- 'year': integer, the manufacturing year of the vehicle- 'price_in_euro': float, the listed price of the vehicle in Euros
Analyze how price varies by manufacturing year.Drop rows where 'year' or 'price_in_euro' is missing, non-numeric, or an outlier.Create a line chart showing average price per year.Write Python code that analyzes the dataset based on my request and produces a matplotlib chart accordingly.Always finish with plt.show() to display the chart."""
    anthropic = Anthropic()
    tools = [        {            'name': 'run_python_code',            'description': 'Run Python code in the sandbox environment and get execution results',            'input_schema': {                'type': 'object',                'properties': {                    'code': {                        'type': 'string',                        'description': 'The Python code to run',                    },                },                'required': ['code'],            },        },    ]
    # Initialize conversation history    messages = [{'role': 'user', 'content': initial_prompt}]
    continue_loop = True    iteration_count = 0    max_iterations = 10
    print("Starting agentic loop...\n")
    while continue_loop and iteration_count < max_iterations:        iteration_count += 1        print(f"\n=== Iteration {iteration_count} ===")        print("Waiting for the model response...")
        # Get response from Claude        msg = anthropic.messages.create(            model='claude-sonnet-4-5',            max_tokens=64000,            messages=messages,            tools=tools        )
        # Log Claude's text response        for content_block in msg.content:            if content_block.type == 'text':                print("\nClaude's response:")                print(content_block.text)
        # Check if Claude wants to use any tools        tool_uses = [block for block in msg.content if block.type == 'tool_use']
        if len(tool_uses) == 0:            # No more tool uses, Claude is done            print("\nTask completed - no more actions needed.")            continue_loop = False            break
        # Add Claude's response to message history        messages.append({'role': 'assistant', 'content': msg.content})
        # Execute all tool calls and collect results        tool_results = []
        for tool_use in tool_uses:            if tool_use.name == 'run_python_code':                code = tool_use.input['code']                print("\n--- Executing Python code in sandbox ---")                print(code)                print("--- End of code ---\n")
                # Execute the code in the sandbox                execution_result = run_ai_generated_code(sandbox, code)
                # Format the tool result                result_content = ""                if execution_result['exit_code'] == 0:                    result_content += "Execution successful!\n\n"                    if execution_result['stdout']:                        result_content += f"Output:\n{execution_result['stdout']}\n"                    if execution_result['charts'] and len(execution_result['charts']) > 0:                        result_content += f"\nGenerated {len(execution_result['charts'])} chart(s)."                    else:                        result_content += "\nNote: No charts were generated. Make sure to use plt.show() to display the chart."                else:                    result_content += f"Execution failed with exit code {execution_result['exit_code']}\n\n"                    if execution_result['stdout']:                        result_content += f"Output:\n{execution_result['stdout']}\n"
                tool_results.append({                    'type': 'tool_result',                    'tool_use_id': tool_use.id,                    'content': result_content                })
                print("Execution result sent back to Claude.")
        # Add tool results to conversation history        messages.append({'role': 'user', 'content': tool_results})
    if iteration_count >= max_iterations:        print("\n⚠️  Reached maximum iteration limit. Task may not be complete.")
    print("\n=== Agentic loop completed ===")

def run_ai_generated_code(sandbox: Sandbox, ai_generated_code: str) -> ExecutionResult:    execution = sandbox.process.code_run(ai_generated_code)
    result = ExecutionResult(        stdout=execution.result or "",        exit_code=execution.exit_code,        charts=execution.artifacts.charts if execution.artifacts else []    )
    # Save any charts that were generated    if execution.artifacts and execution.artifacts.charts:        result_idx = 0        for chart in execution.artifacts.charts:            if chart.png:                filename = f'chart-{result_idx}.png'                with open(filename, 'wb') as f:                    f.write(base64.b64decode(chart.png))                print(f'✓ Chart saved to {filename}')                result_idx += 1
    return result

if __name__ == "__main__":    main()
import "dotenv/config";import fs from "fs";import Anthropic from "@anthropic-ai/sdk";import { Daytona, Sandbox } from "@daytonaio/sdk";import type { MessageParam, Tool, ToolUseBlock,} from "@anthropic-ai/sdk/resources/messages.mjs";
interface CodeRunToolInput { code: string;}
interface ExecutionResult { stdout: string; exitCode: number; charts?: Array<{ png?: string }>;}
async function main() { // Create sandbox const daytona = new Daytona(); const sandbox = await daytona.create();
// Upload the dataset to the sandbox await sandbox.fs.uploadFile("dataset.csv", "/home/daytona/dataset.csv");
const initialPrompt = `I have a CSV file with vehicle valuations saved in the sandbox at /home/daytona/dataset.csv.
Relevant columns:- 'year': integer, the manufacturing year of the vehicle- 'price_in_euro': float, the listed price of the vehicle in Euros
Analyze how price varies by manufacturing year.Drop rows where 'year' or 'price_in_euro' is missing, non-numeric, or an outlier.Create a line chart showing average price per year.Write Python code that analyzes the dataset based on my request and produces a matplotlib chart accordingly.Always finish with plt.show() to display the chart.`;
const anthropic = new Anthropic({ apiKey: process.env.ANTHROPIC_API_KEY });
const tools: Tool[] = [ { name: "run_python_code", description: "Run Python code in the sandbox environment and get execution results", input_schema: { type: "object", properties: { code: { type: "string", description: "The Python code to run", }, }, required: ["code"], }, }, ];
// Initialize conversation history const messages: MessageParam[] = [ { role: "user", content: initialPrompt }, ];
let continueLoop = true; let iterationCount = 0; const maxIterations = 10;
console.log("Starting agentic loop...\n");
while (continueLoop && iterationCount < maxIterations) { iterationCount++; console.log(`\n=== Iteration ${iterationCount} ===`); console.log("Waiting for the model response...");
// Get response from Claude const stream = anthropic.messages.stream({ model: "claude-sonnet-4-5", max_tokens: 64000, messages: messages, tools: tools, });
const message = await stream.finalMessage();
// Log Claude's text response for (const contentBlock of message.content) { if (contentBlock.type === "text") { console.log("\nClaude's response:"); console.log(contentBlock.text); } }
// Check if Claude wants to use any tools const toolUses = message.content.filter( (block): block is ToolUseBlock => block.type === "tool_use" );
if (toolUses.length === 0) { // No more tool uses, Claude is done console.log("\nTask completed - no more actions needed."); continueLoop = false; break; }
// Add Claude's response to message history messages.push({ role: "assistant", content: message.content, });
// Execute all tool calls and collect results const toolResults = [];
for (const toolUse of toolUses) { if (toolUse.name === "run_python_code") { const code = (toolUse.input as CodeRunToolInput).code; console.log("\n--- Executing Python code in sandbox ---"); console.log(code); console.log("--- End of code ---\n");
// Execute the code in the sandbox const executionResult = await runAIGeneratedCode(sandbox, code);
// Format the tool result let resultContent = ""; if (executionResult.exitCode === 0) { resultContent += `Execution successful!\n\n`; if (executionResult.stdout) { resultContent += `Output:\n${executionResult.stdout}\n`; } if (executionResult.charts && executionResult.charts.length > 0) { resultContent += `\nGenerated ${executionResult.charts.length} chart(s).`; } else { resultContent += `\nNote: No charts were generated. Make sure to use plt.show() to display the chart.`; } } else { resultContent += `Execution failed with exit code ${executionResult.exitCode}\n\n`; if (executionResult.stdout) { resultContent += `Output:\n${executionResult.stdout}\n`; } }
toolResults.push({ type: "tool_result" as const, tool_use_id: toolUse.id, content: resultContent, });
console.log("Execution result sent back to Claude."); } }
// Add tool results to conversation history messages.push({ role: "user", content: toolResults, }); }
if (iterationCount >= maxIterations) { console.log( "\n⚠️ Reached maximum iteration limit. Task may not be complete." ); }
console.log("\n=== Agentic loop completed ===");}
async function runAIGeneratedCode( sandbox: Sandbox, aiGeneratedCode: string): Promise<ExecutionResult> { const execution = await sandbox.process.codeRun(aiGeneratedCode);
const result: ExecutionResult = { stdout: execution.result || "", exitCode: execution.exitCode, charts: execution.artifacts?.charts, };
// Save any charts that were generated if (execution.artifacts?.charts) { let resultIdx = 0; for (const chart of execution.artifacts.charts) { if (chart.png) { const filename = `chart-${resultIdx}.png`; fs.writeFileSync(filename, chart.png, { encoding: "base64", }); console.log(`✓ Chart saved to ${filename}`); resultIdx++; } } }
return result;}
main().catch(console.error);