


I have worked on numerous software systems over the years, and I've learned first-hand how crucial observability is for any successful platform, especially for enterprises. In my experience, observability is far more nuanced than simply logging, monitoring, and alerting. It's about truly understanding when and where to apply these techniques.
In this article, I'll share my insights on the key aspects of observability and how the platform I helped build, Daytona, delivers an optimal solution tailored to enterprises.
The Three Pillars: Logs, Traces, and Metrics
From my vantage point, there are three foundational pillars of observability: logs, traces, and metrics. Each serves a distinct purpose in illuminating the inner workings of a system.
Logging records discrete events happening within components. However, I've found issues can arise when non-essential events generate massive noisy logs, obscuring valuable signals. It's essential to consider what to track and log based on relevance carefully. For example, a single slow request may just be a temporary lag, not necessitating an alarm.
Tracing provides a broader continuous view of an application, tracking the flow and progression of data. It empowers developers to follow a user's journey end-to-end through a complex stack, identifying performance bottlenecks to address. Tracing is about holistic optimization.
Metrics quantify the health and operations of a system at a point in time. Due to their compact nature, metrics enable efficient large-scale collection and aggregation. This lends itself well to powering automated alerts on component health.
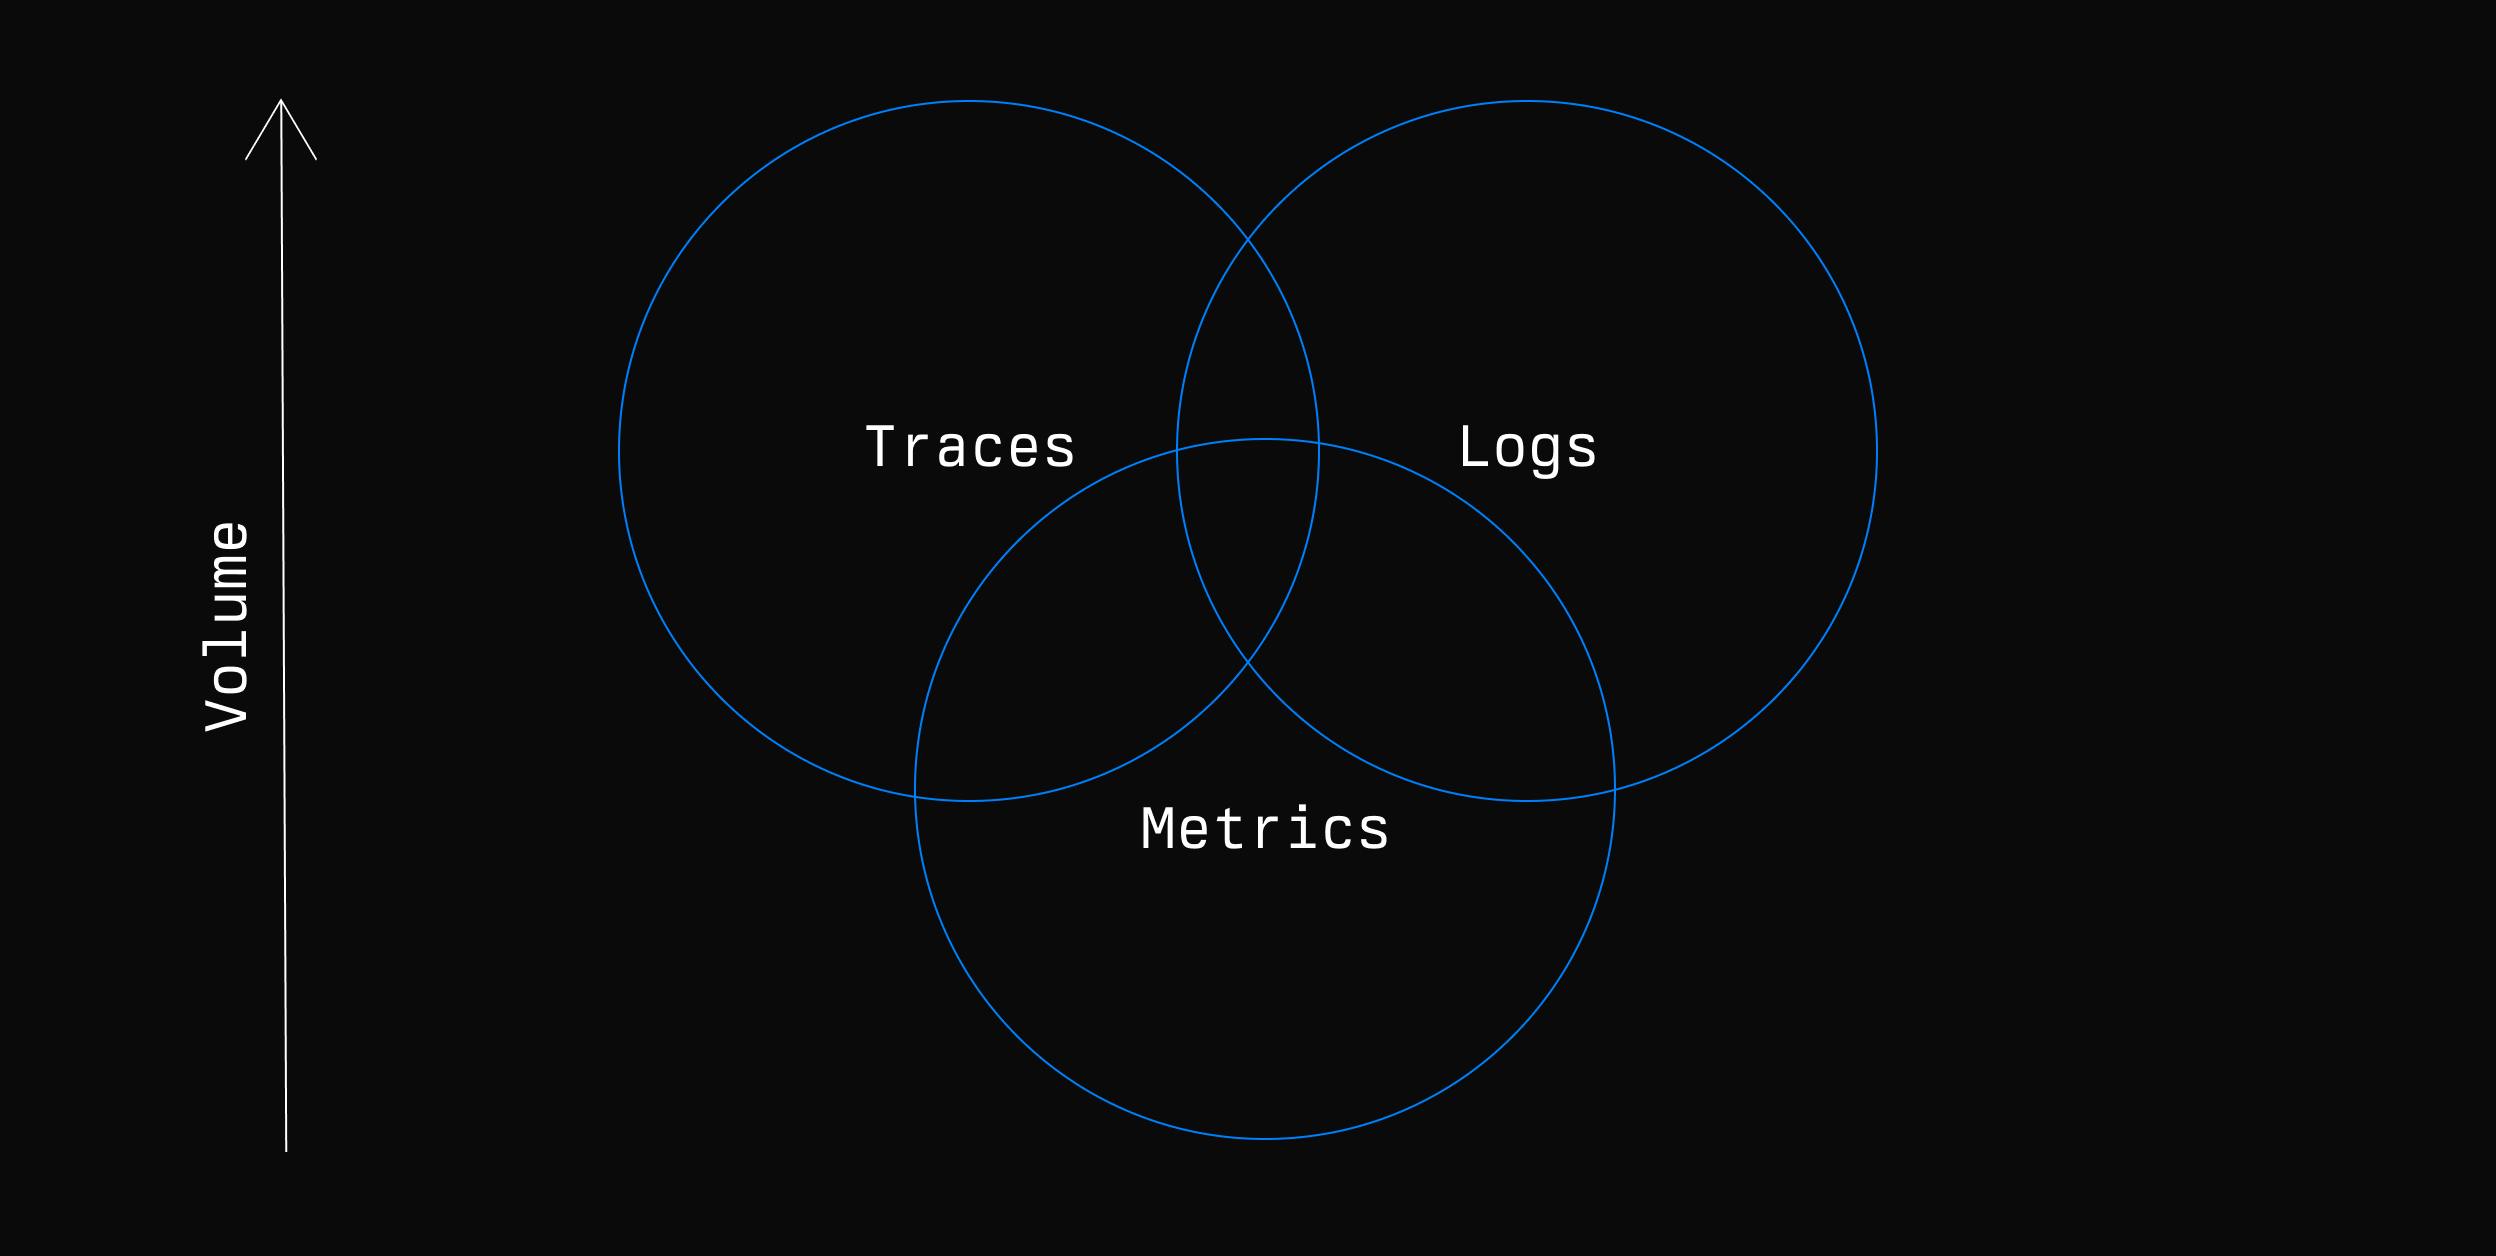
In DevOps, having observability tools that seamlessly integrate metrics, traces, and logs provides a holistic view of system health and performance, allowing teams to address issues and optimize systems proactively.
When considering observability tools, the intersection of these pillars means:
Metrics + Logs: A situation where, upon detecting an anomaly in metrics (like a spike in error rate), you'd dive into logs to get detailed context about individual errors.
Traces + Logs: While investigating a particular slow request using traces, you might refer to logs from a specific service in the trace to understand why it was slow.
Metrics + Traces: This might be a situation where a metric indicates a slowdown in response times, and traces are used to identify which service or component is the bottleneck.
All three intersecting: A comprehensive observability solution where an anomaly in metrics leads to trace investigation, which in turn is supplemented with log data for full context.
The Customizable Daytona Approach
With Daytona, we took a unique approach to deliver an observability solution tailored to client needs. A key advantage is Daytona's tooling agnosticism, providing flexibility and control.
For logging, Daytona exposes logs, but clients can integrate any log collection and storage tools they prefer, whether Splunk, Elasticsearch or otherwise. We give them full freedom here.
Similarly, for monitoring, Daytona exposes Prometheus metrics, an industry standard. But clients can build custom dashboards covering areas beyond Daytona's default metrics. They own the visualization.
For example, they could use Grafana, a visualization tool for Prometheus metrics. We can offer a set of suggested dashboards, but the client can add whatever they want and set up dashboards for things we don't even have. It's up to them.
For distributed tracing, we leverage the OpenTelemetry standard so clients aren't locked into any vendor. They can choose where to store and analyze tracing data.
Empowering Enterprises with Observability
As an enterprise-focused platform, Daytona grants clients strong observability capabilities while retaining flexibility.
Clients gain an overview of their systems with Daytona's logging, tracing and metrics. But they can utilize whichever tools they prefer for storage and analysis based on their workflows.
Daytona provides suggested dashboards, but enterprises can customize these and expand beyond Daytona's defaults. They own the level of monitoring that fits their needs.
With OpenTelemetry tracing, clients have freedom to enable or disable it and integrate it with their existing tracing solution.
In summary, Daytona delivers comprehensive observability with the configurability and control vital for regulated enterprises. As we continue enhancing Daytona, this enterprise focus will remain central to our approach.
We've built capabilities into Daytona to serve the complex needs of enterprises. This differentiation will only expand as we partner closely with our clients to evolve Daytona's strengths. With the right observability foundation, our platform unlocks untapped potential for organizations to deliver innovation at new velocities.